Why Us
Data Analytics & BI Solutions: Turn Raw Data into Clear Insights and Smarter Decisions
Most businesses already have data — in spreadsheets, ERP systems, CRMs, marketing tools, and operational platforms. The real challenge is not collecting data, but transforming it into reliable insights that leaders can act on. Without structure, data becomes noise: inconsistent reports, conflicting numbers, and dashboards no one fully trusts.
ZS Global delivers Data Analytics and Business Intelligence solutions using platforms like Power BI and Tableau to bring clarity, consistency, and visibility across your organization. We design reporting systems that connect data sources, standardize metrics, and present insights in ways that drive confident, data-driven decision-making. From executive dashboards to operational performance tracking, we ensure your data tells a clear story — helping you optimize performance, control costs, and identify growth opportunities with precision.
Business Intelligence: A Strategic Advantage for Modern Organizations
-
Centralized Data Visibility
We connect data from multiple business systems into unified dashboards, eliminating fragmented reporting and giving leadership a single, trusted source of truth.
-
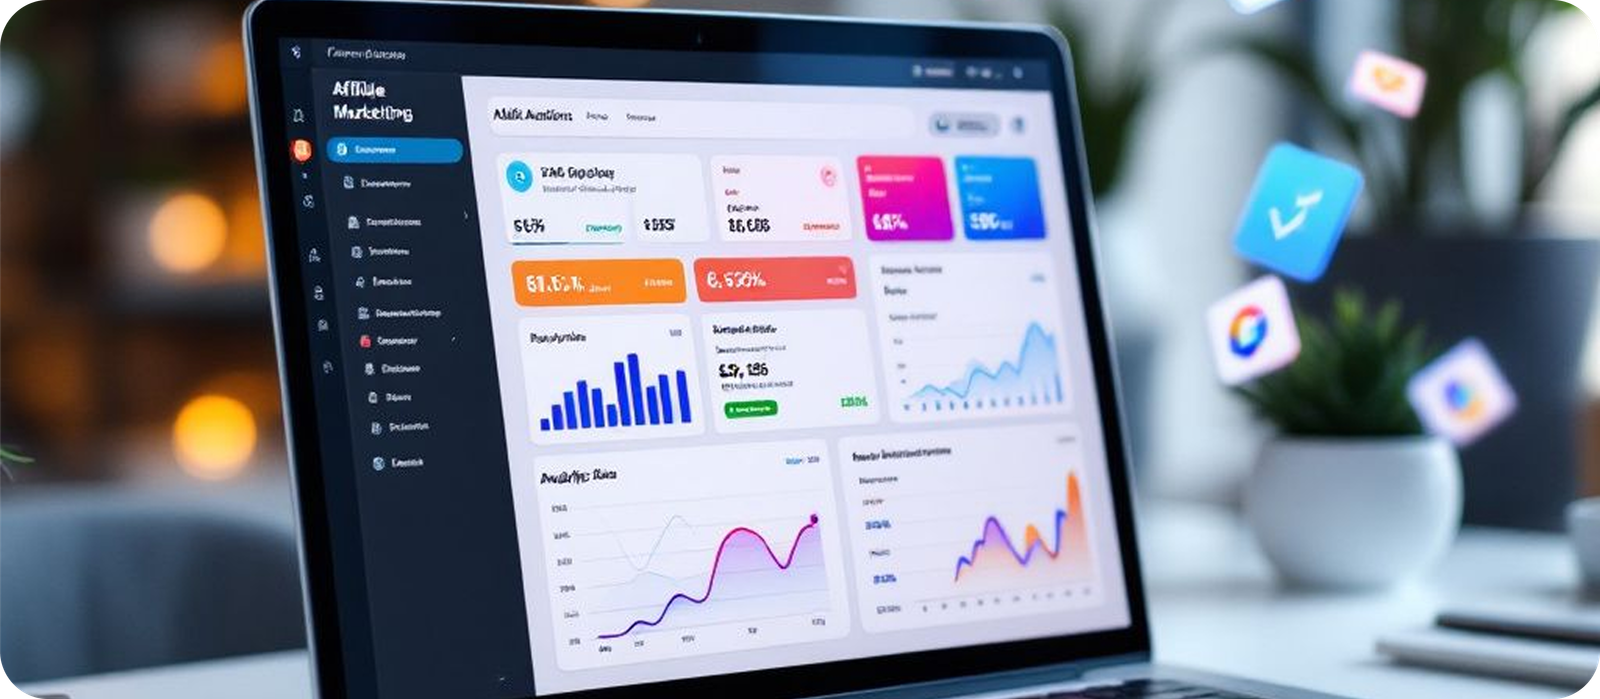
Interactive Dashboards and Visual
Reporting
Using Power BI and Tableau, we build intuitive dashboards that allow users to explore trends, drill into performance, and understand results at a glance.
-
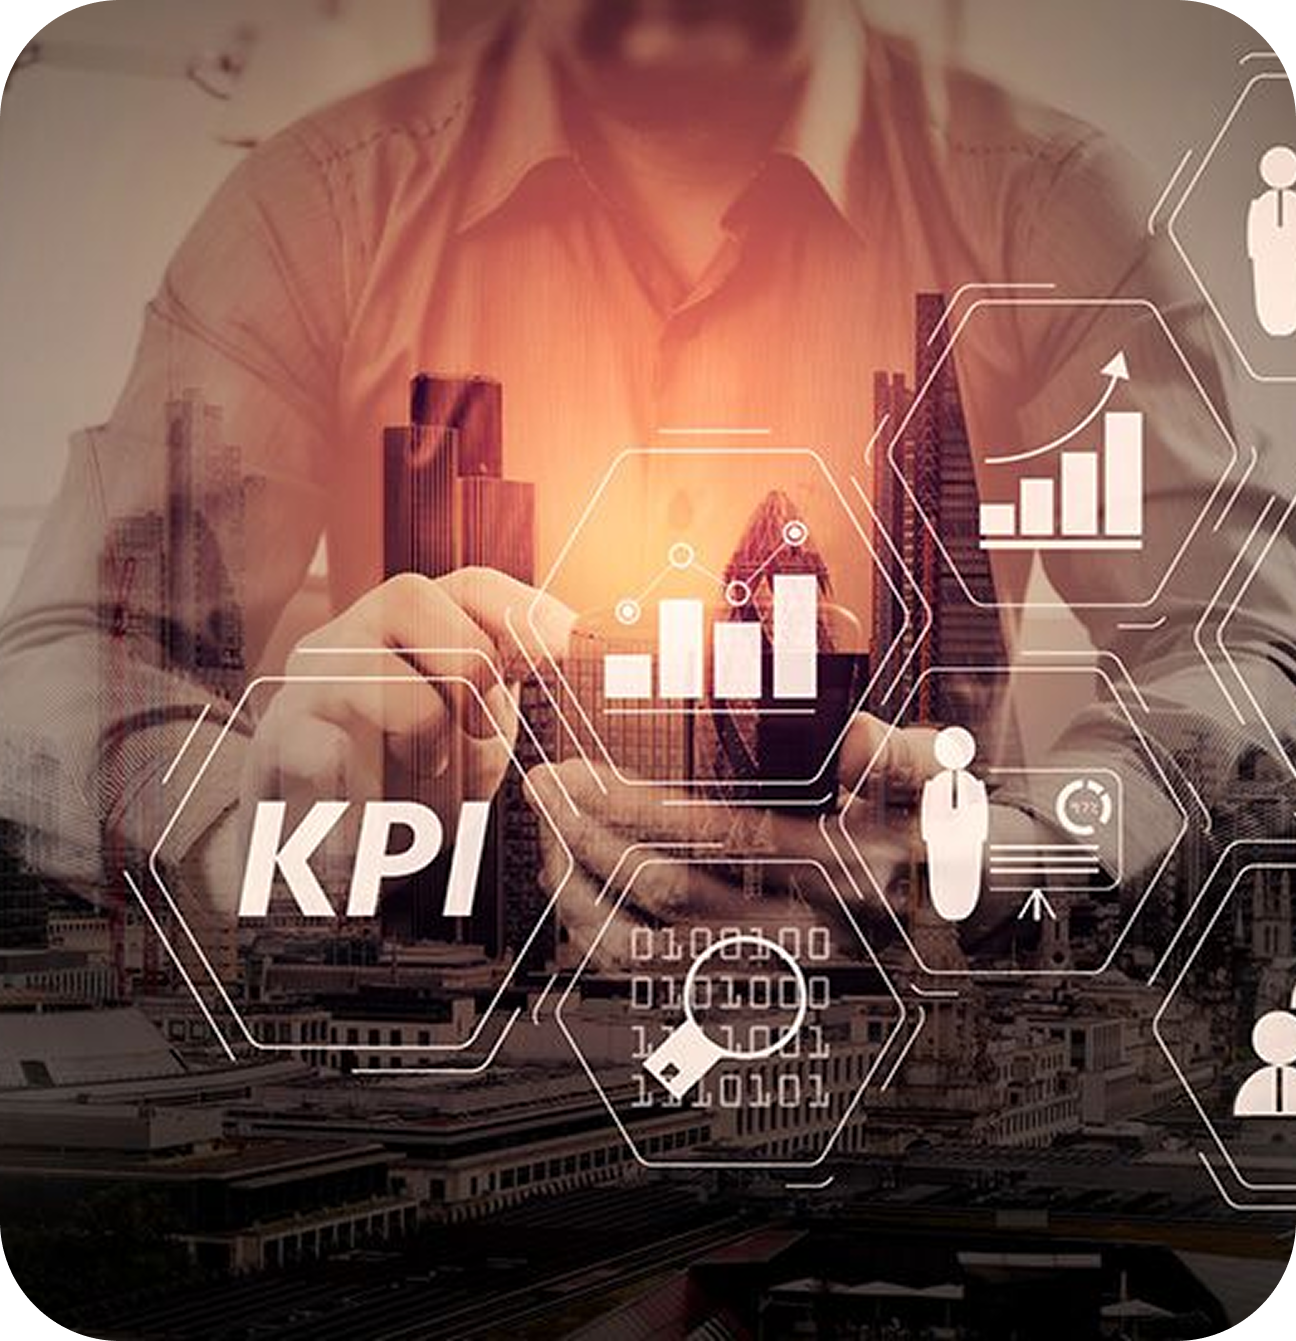
Standardized Metrics and KPIs
Inconsistent definitions create confusion. We define clear KPIs and reporting logic so teams align on the same numbers and business priorities.
-
Real-Time and Scheduled Reporting
We design data pipelines that support near real-time insights where needed, as well as structured periodic reporting for operational and strategic review.
-
Data Accuracy and Governance
Reliable insights require clean data. We implement validation checks, transformation rules, and governance practices that improve data quality and consistency.
-
Department-Level Performance
Insights
From sales and marketing to operations and finance, we design role-specific dashboards that provide actionable visibility for each function.
-
Scalable Reporting Architecture
As your business grows, reporting needs evolve. We build BI environments that can scale across new data sources, departments, and performance dimensions.
-
Decision Support for Leadership
Our BI solutions empower leadership with strategic insights into revenue, cost, performance trends, and growth opportunities.
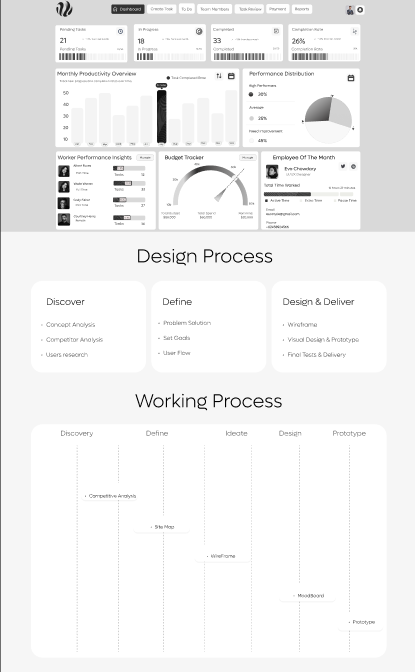
Our Process
A Structured BI Implementation Process for Trusted Insights
Delivering reliable business intelligence requires more than dashboard design. ZS Global follows a structured process that ensures data integrity, alignment with business goals, and long-term scalability.
We identify key business questions, stakeholders, and decision-making needs to ensure reporting focuses on meaningful outcomes.
We map all relevant data sources including ERP, CRM, finance systems, marketing tools, and spreadsheets to design a unified data flow.
We design data models that structure raw data into meaningful relationships, metrics, and hierarchies for reporting.
We create intuitive dashboards in Power BI or Tableau that present insights clearly while allowing users to explore underlying details.
We review metrics with stakeholders to ensure dashboards reflect agreed definitions and business logic.
We publish dashboards, configure access controls, and train users so they can interpret insights confidently.
We automate data refresh processes to ensure reports remain current without manual effort.
We document data sources, transformations, and reporting logic to maintain consistency and trust over time.
As business needs evolve, we refine dashboards, add data sources, and improve performance to keep reporting relevant.
Data & BI Initiatives that Strengthen Performance and Decision-Making
Designing and deploying interactive dashboards that provide real-time business performance visibility.
Building leadership-level views that summarize revenue, cost, profitability, and strategic KPIs.
Analyzing pipeline performance, campaign results, and customer trends to improve growth strategies.
Tracking operational efficiency, inventory, and process performance to identify optimization opportunities.
Providing structured financial visibility to support budgeting, forecasting, and cost control.
Connecting multiple systems and transforming raw data into structured reporting datasets./p>
Empowering teams with tools and training to explore data independently within governed frameworks.
Defining performance metrics that align reporting with strategic business objectives.
Improving data consistency, validation, and accountability across reporting environments.
Preparing structured data foundations that can support predictive analytics and AI initiatives.
Our Initiative
Key Outcomes for Business Success
- Unified and reliable reporting across departments
- Clear visibility into revenue, cost, and performance trends
- Faster and more confident data-driven decision-making
- Improved operational efficiency through performance insights
- Consistent KPI definitions across teams
- Reduced manual reporting effort through automation
- Scalable BI architecture ready for future growth
Our Works
Check out some of our favorite projects to date. Yours may be next!
Ops Loop
- AWS
- ReactJS
- Ruby on Rails
- UI/UX
Your microtask operations platform connecting teams with reliable workers. It enables quick, cost-effective completion of labeling, QA, and content tasks, offering workers steady gigs, transparent pay, and flexibility. Opsloop balances speed, scale, and fairness for efficient micro-work.
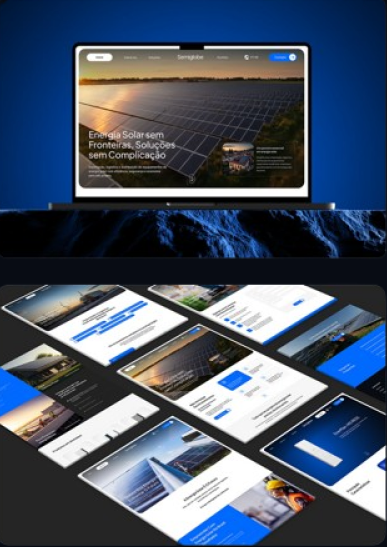
Semi Globe
- Ionic
- Laravel
- PHP
- ReactJS
- UI/UX
The platform was strategically designed to convey the personality of a reliable and forward-thinking specialist, presenting its end-to-end logistics solution in a clear and accessible way. The result is a digital presence that builds immediate credibility and positions.
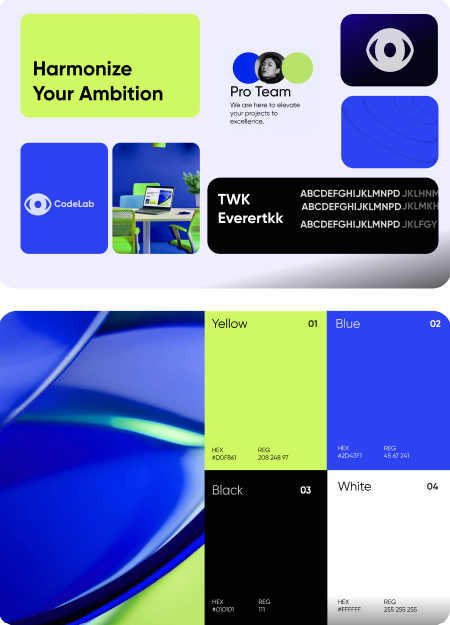
CodeLab
- Shopify
- UI/UX
- Wordpress
Branding journey began with an in-depth exploration of the company's ethos, values, and aspirations. Extensive market research and competitor analysis provided valuable insights into the ever-evolving world of software development and technology solutions. Understanding CodeLab's unique selling propositions and target audience paved the way for a strategic branding approach.
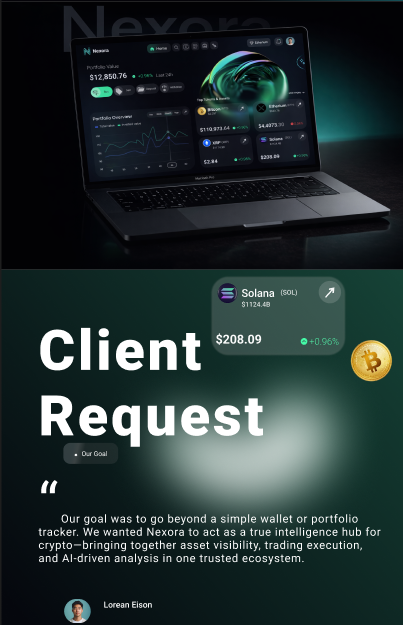
NEXORA
- AWS
- Circle CI
- Ruby on Rails
- Stripe
- Twillio
- UI/UX
- VueJS
A cloud-based Crypto SaaS platform that consolidates digital asset management, cross-exchange trading, and predictive AI insights into one ecosystem.
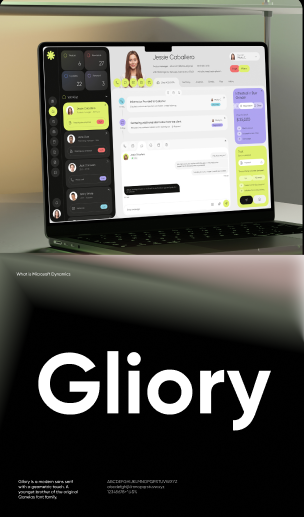
Microsoft CRM
- Shopify Plus
- UI/UX
Microsoft Dynamics is a comprehensive CRM for sales.
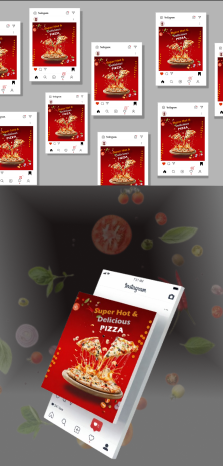
Pizza
- Apache Solr
- AWS
- Ruby on Rails
- Transcoding
A dynamic property analytics system delivering real-time data visualization and insights.

Attar
- AWS
- Normalisation
- ReactJS
- Ruby on Rails
- Visualisation
While the original attar bottle photos were captured in a real setting, the images lacked clarity, detail, and professional lighting — which made them unsuitable for a luxury campaign. The challenge was to enhance and reimagine these imperfect visuals into premium-quality product shots without redoing the entire photoshoot.

Chocovia
- AI Chat Bots
- NFT
- NLP
- NodeJS
An AI-driven digital wellness platform combining intelligent health management and rewards.
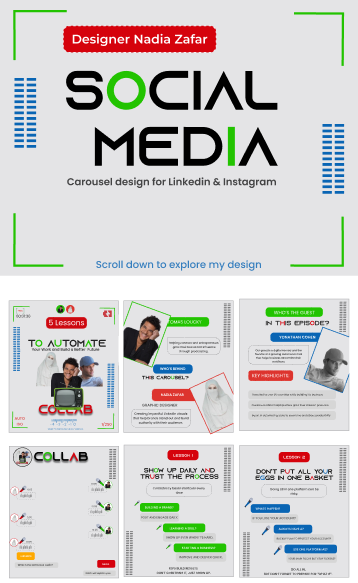
Carousel - Social Media Design
- Capistrano
- PostGres
- React Native
- Ruby on Rails
- UI/UX
A next-gen recruitment platform automating hiring and candidate engagement.
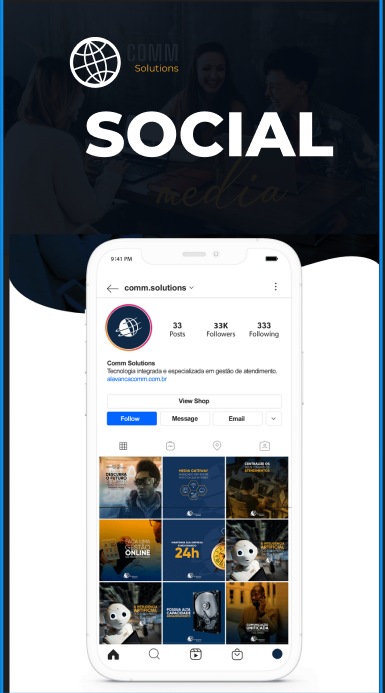
Comm Solutions
- N-Genius Payments
- PHP Laravel
- UI/UX
- Wordpress
A luxury vacation rental platform offering seamless booking and content management.
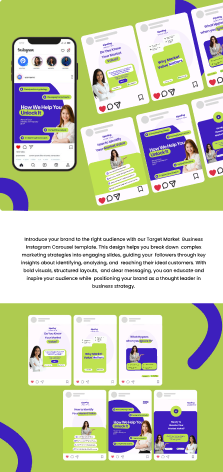
Target Market Business
- AWS
- MERN
- Ruby on Rails
- UI/UX
Introduce your brand to the right audience with our Target Market Business Instagram Carousel template. This design helps you break down complex marketing strategies into engaging slides, guiding your followers through key insights about identifying, analyzing, and reaching their ideal customers. With bold visuals, structured layouts, and clear messaging, you can educate and inspire your audience while positioning your brand as a thought leader in business strategy.
FAQ
Data Analytics & Business Intelligence (Power BI, Tableau): Frequently Asked Questions (FAQs)
What platforms do you use for BI solutions?
Can you connect BI dashboards to our existing systems?
How do you ensure data accuracy?
Do you provide executive-level dashboards?
Can teams create their own reports?
How often can dashboards update?
Do you help define KPIs?
Can BI solutions scale as we grow?
What training do you provide?
How can I start working with ZS Global?
Turn Data into Decisions with ZS Global BI Solutions
Harness the power of structured analytics and business intelligence to drive smarter strategies and measurable growth. ZS Global helps you transform scattered data into clear, trusted insights that support confident decision-making.
Contact Us
How Can
We Help You?
We Help You?
-
You can also write us on our e-mail
corporate.communications@zs-global.us